
ここではapacheの状態を監視してパフォーマンスや異常を検知したい場合の設定方法を、lorfさんという方が公開されている方法で説明します
まずはlorfさんのGitHubのDownload ZIPボタンからZIPファイルを取得しておいて下さい
lorf/zapache
https://github.com/lorf/zapache
監視対象サーバ側の設定
apacheの設定変更
標準ではステータス取得の機能はOffになっているので、設定変更のためにhttpd.confを編集します
$ sudo vi /etc/httpd/conf/httpd.conf
まずは ExtendedStatusがデフォルトでOffになっているので、コメントを外してOnにします
#
# ExtendedStatus controls whether Apache will generate "full" status
# information (ExtendedStatus On) or just basic information (ExtendedStatus
# Off) when the "server-status" handler is called. The default is Off.
#
# ExtendedStatus Off
ExtendedStatus On
次に、server-statusへのアクセス許可設定のコメントを外し、アクセスをlocalhostのみ許可します
#
# Allow server status reports generated by mod_status,
# with the URL of http://servername/server-status
# Change the ".example.com" to match your domain to enable.
#
#<Location /server-status>
#    SetHandler server-status
#    Order deny,allow
#    Deny from all
#    Allow from .example.com
#</Location>
<Location /server-status>
    SetHandler server-status
    Order deny,allow
    Deny from all
    Allow from localhost
</Location>
保存したら、httpdを再起動します
$ sudo service httpd restart
WordPress利用時の注意点と変更
WordPressをドキュメントルートに設置して運用している場合、mod_rewriteでアクセスのあったURLの書き換えを行なっている場合があります
その場合、http://localhost/server-status/へのアクセスも書き換えようとして、正しくアクセスできません
例えば、/var/www/html/wordpressがドキュメントルートになっている場合は、以下のように.htaccessを変更します
$ sudo vi /var/www/html/wordpress/.htaccess
ハイライトされている行を追加し、書き換えの対象から外します
# BEGIN WordPress
#<IfModule mod_rewrite.c>
RewriteEngine On
RewriteBase /
RewriteRule ^index\.php$ - [L]

# add a trailing slash to /wp-admin
RewriteRule ^wp-admin$ wp-admin/ [R=301,L]

RewriteCond %{REQUEST_FILENAME} -f [OR]
RewriteCond %{REQUEST_FILENAME} -d
RewriteRule ^ - [L]
RewriteRule ^(wp-(content|admin|includes).*) $1 [L]
RewriteRule ^(.*\.php)$ $1 [L]
RewriteCond %{REQUEST_FILENAME} !^.*/server-status.*
RewriteRule . index.php [L]
#</IfModule>
# END WordPress
アクセスの確認
以下のようにアクセスし、「Apache Status」というタイトルのHTMLドキュメントがダウンロードされるのを確認します
$ curl http://localhost/server-status
値取得用シェルスクリプトの設置とZabbix-agentの設定
冒頭のGitHubよりzapacheをダウンロードし、任意のフォルダに設置します
$ sudo mkdir /etc/zabbix/script
$ sudo install -o root -g root -m 0755 zapache /etc/zabbix/script/zapache.sh
もしくは、以下のコマンド群を順に実行し、最後viが開いたら、https://github.com/lorf/zapache/blob/master/zapache のシェルスクリプトをコピペして保存します
$ sudo mkdir /etc/zabbix/script
$ sudo touch /etc/zabbix/script/zapache.sh
$ sudo chmod 755 /etc/zabbix/script/zapache.sh
$ sudo vi /etc/zabbix/script/zapache.sh
次に、zabbix agentの設定ファイルを書き換えます
$ sudo vi /etc/zabbix/zabbix_agentd.conf
UserParameterに1行追加してください
### Option: UserParameter
#       User-defined parameter to monitor. There can be several user-defined parameters.
#       Format: UserParameter=<key>,<shell command>
#       See 'zabbix_agentd' directory for examples.
#
# Mandatory: no
# Default:
# UserParameter=

UserParameter=zapache[*],sh /etc/zabbix/script/zapache.sh \$1
zabbix agentを再起動します
$ sudo service zabbix-agent restart
Zabbixサーバ側の設定
テンプレートのインポート
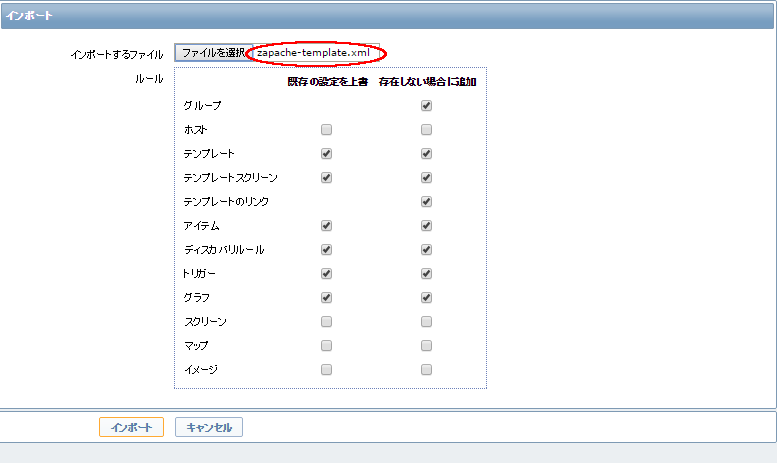
ZabbixフロントエンドGUIを開き、[設定]-[テンプレート]の[インポート]から、テンプレートのインポートを行ないます
下の画面を使って、最初に取得したzapache-masterの中にある、zapache-template.xmlとzapache-template-active.xmlをそれぞれインポートします
ホストへのテンプレートの適用
前半の設定を実施済みのホストをホスト一覧から選択し、テンプレートをリンクさせます
これでapacheの状態監視が開始され、いくつかのグラフも定義されているので、そちらでグラフィカルに負荷状況などを確認することが可能になりました
↓↓↓ブログランキングに参加しています↓↓↓


↑↑↑応援よろしくお願いします↑↑↑
| ■ AD ■ | |
|---|---|